
A breakout gauge you can feel
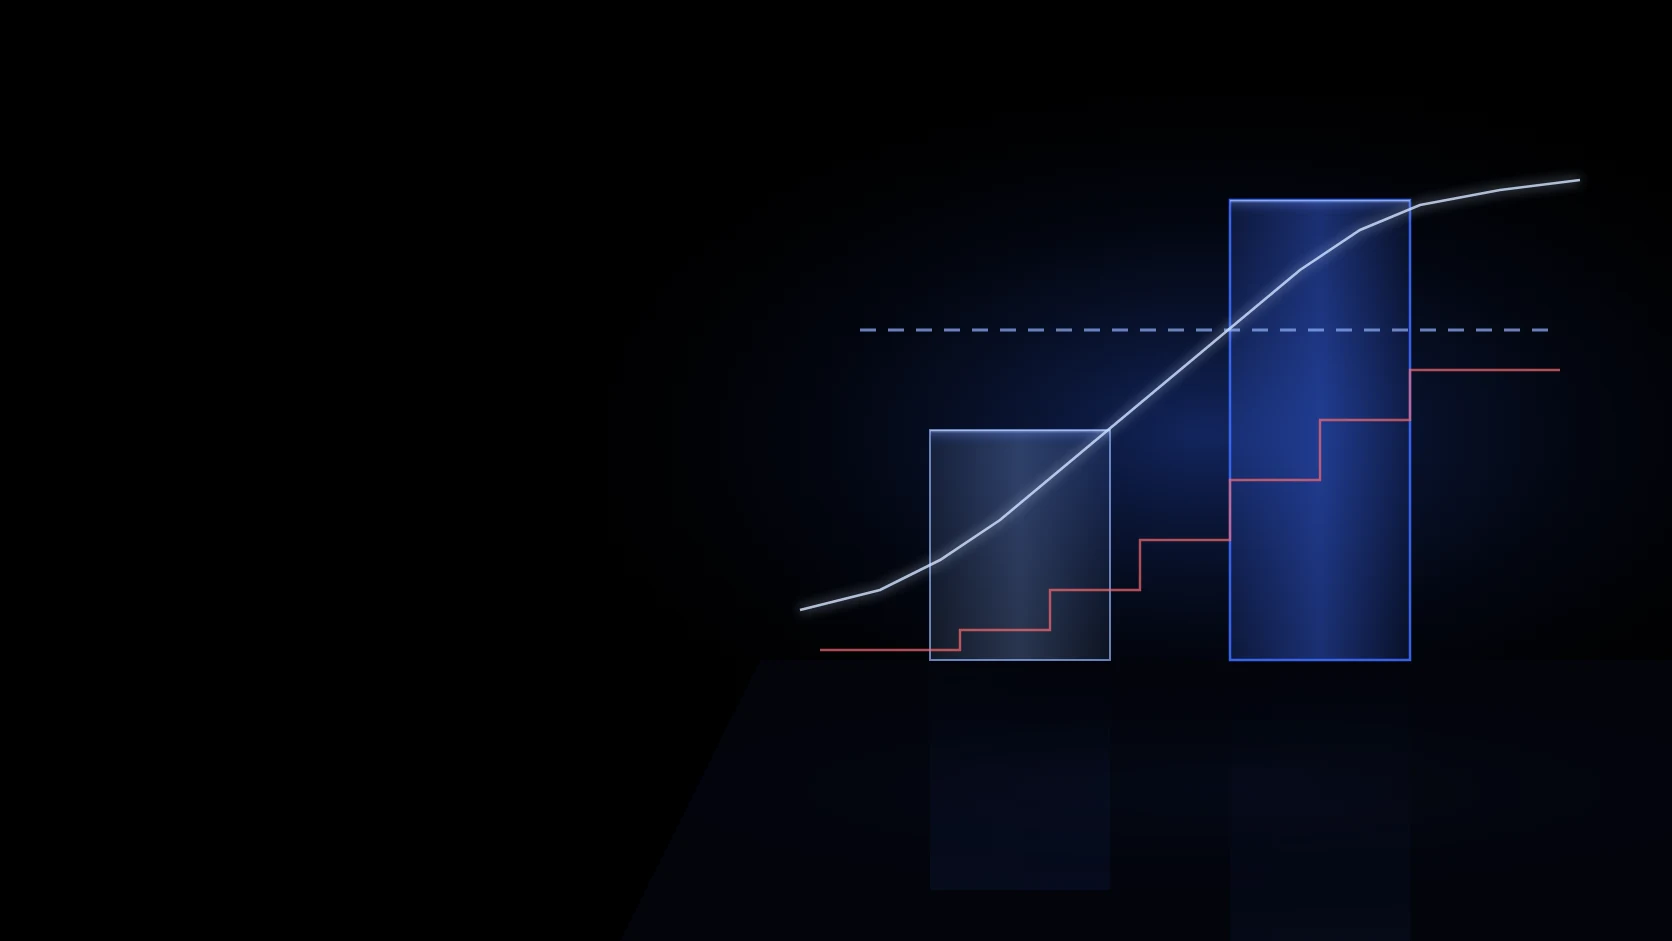
The gauge fills as price nears open + 0.7× the prior day's range; ⚡ fires the instant it breaks.
Board at the moment it explodes and ride to the end: a volatility breakout entry, a trend guarded by the 20-day line.
Breakout entry → exit at the next open · 0.05% fee per buy and per sell included
Across all 274 Tesla trades since 2018, the average return per trade was +2.17%.
Tesla: in on the $37.409 breakout on 2020-04-07, out at $96.613 on 2020-08-03. 81 trading days, +158.0% after fees.
Change = (exit × (1 − 0.05%)) ÷ (entry × (1 + 0.05%)) − 1.
Download the case data (JSON)Guessing by eye whether it broke out, then chasing late
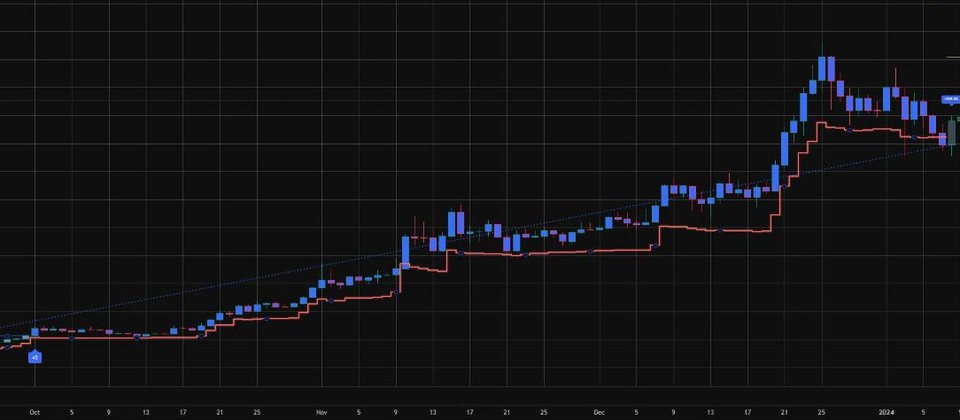
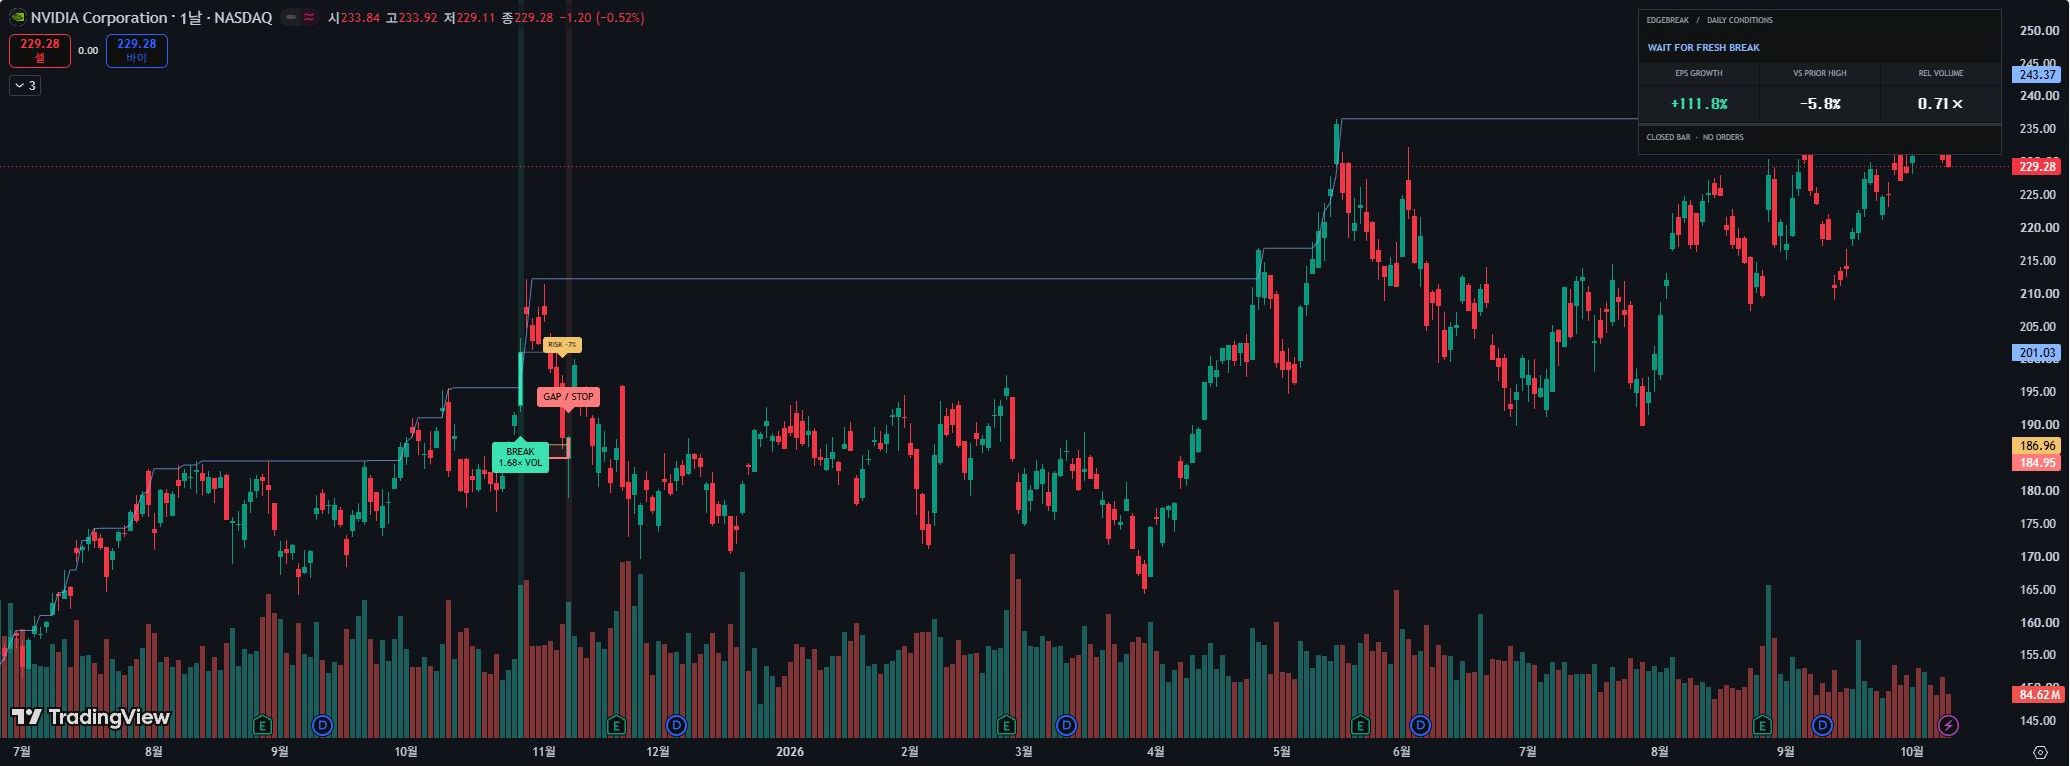
Breakout line and gauge on the chart; ⚡ marks the exact moment it breaks
Selling the next morning, then watching it fly
Hold until the 20-day line breaks and follow the body of the trend
Not knowing if it works on the ticker you picked
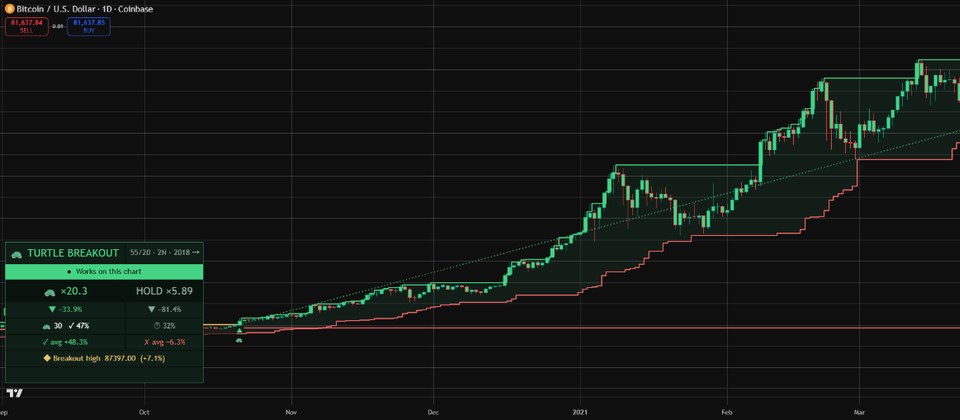
A fee-adjusted scorecard compares hold vs breakout on the chart in a second
The gauge fills as price nears open + 0.7× the prior day's range; ⚡ fires the instant it breaks.
Don't get off after a day. Hold until a close breaks the 20-day line and follow the uptrend to the end.
0.05% fees included: compare return multiple, MDD and win rate against holding, right on the chart.
Bitcoin 2018–26: versus plain holding, max drawdown cut from −81.4% to −65.2% and annual return nearly doubled (+22.4% → +42.3%).
Past data doesn’t guarantee future returns, but it is the most honest way to see which kinds of markets play to its strengths. These are 2018–2026 annual figures after deducting a 0.05% fee on every buy and every sell.
| Market | Breakout Gate / yr | Buy & hold / yr | Gate deepest drop | Hold deepest drop | Trades |
|---|---|---|---|---|---|
| Bitcoin | +42.3% | +22.4% | −65.2% | −81.4% | 395 |
| Ethereum | +62.8% | +14.5% | −60.7% | −94.0% | 401 |
| Tesla | +58.2% | +38.5% | −42.7% | −73.6% | 274 |
| KOSDAQ | +13.8% | −0.6% | −18.2% | −53.8% | 208 |
| KOSPI | +10.6% | +9.6% | −27.7% | −43.9% | 238 |
| Nasdaq Composite | +14.4% | +16.6% | −20.1% | −36.4% | 206 |
| NVIDIA | +35.8% | +54.0% | −55.1% | −66.4% | 225 |
| S&P 500 | +5.4% | +12.8% | −19.4% | −33.9% | 201 |
| Gold futures | +4.2% | +14.2% | −27.1% | −24.9% | 286 |
Only the worst crashes, side by side (daily, 0.1% cost per side)
2022 bear market, Tesla: holding took $1,000 to $322. Gate: −6.1% ($939)
2008 crisis, KOSDAQ: holding took $1,000 to $528. Gate went the other way: +32.5% ($1,325)
2008 crisis, S&P 500: holding took $1,000 to $522. Gate: −13.3% ($867)
Right after payment: copy the code or download the TXT, with guides in 8 languages and 30 days of bug care.
Past performance does not guarantee future results.
An independently coded interpretation of the volatility-breakout idea Larry Williams described in his books, with ChartArmory’s own trend-hold exit and scorecard. Not affiliated with or endorsed by him.
The typical bot uses k = 0.5 and always sells at the next morning’s open after entry, an ultra-short-term style with frequent trades and heavy fees. Breakout Gate raises the bar to a breakout of 0.7 × the previous day’s range, holds until a close falls below the 20-day average, then exits at the next candle’s open. That cuts trading to about 20–45 trades a year and lets you follow long trends to the end.
No, it doesn’t repaint. The breakout line is fixed when the day opens. ⚡ appears on a live candle the moment the high touches the line and does not disappear afterwards. Exits are also decided on the closed candle’s close and executed at the next candle’s open, and the scorecard assumes exact fills at the breakout line.
It has the edge in volatile markets where trends and downturns clearly alternate, such as Bitcoin, Ethereum, Tesla and KOSDAQ. On steadily rising assets such as the S&P 500, gold and NVIDIA, it can earn less than simply holding. And because it exits at the next candle’s open, an overnight gap down on bad news can cause a bigger loss than expected. Past results do not guarantee future returns.
You can edit it for personal use. Sharing, redistribution and resale rights are not included.
One US$59 payment: the full source code, lifetime use and freedom to customise.
TOP WARNING
CRASH BUYING
POSITION SIZING
TREND BREAKOUT
LONG-TERM TREND
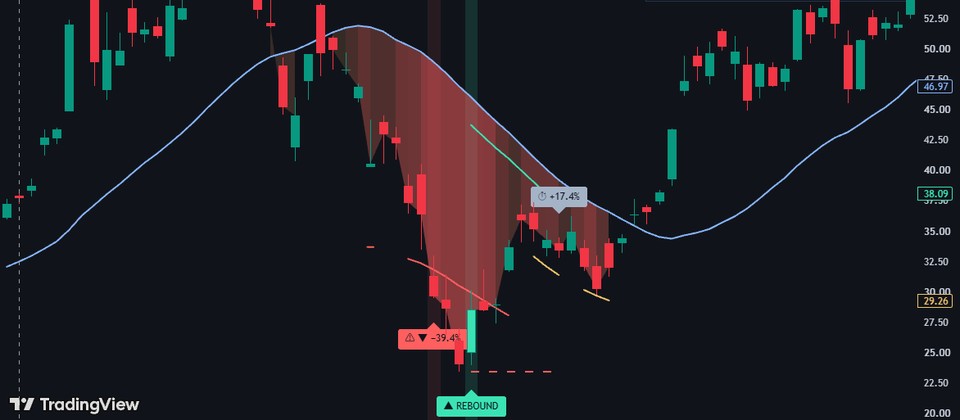
REBOUND OBSERVATION
BREAKOUT OBSERVATION
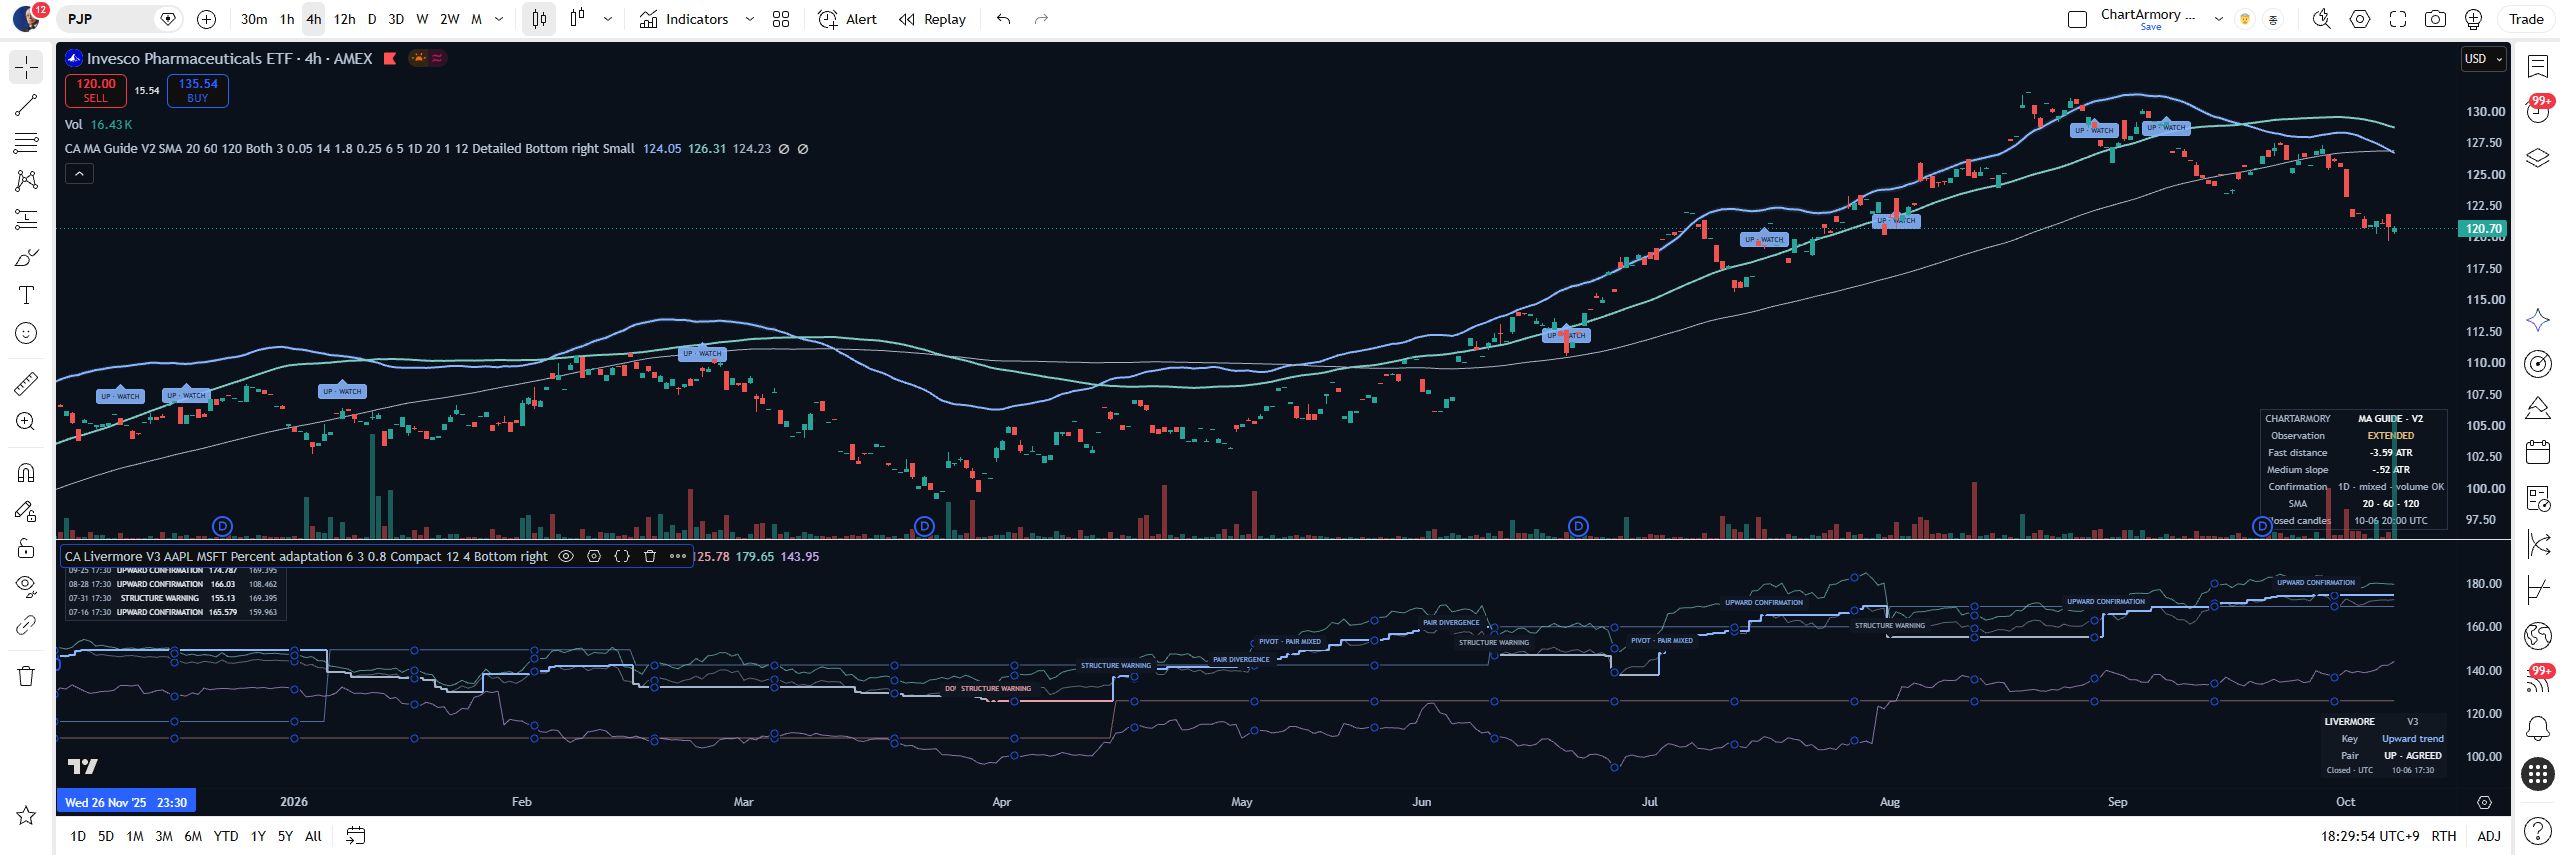
LIVERMORE · V3
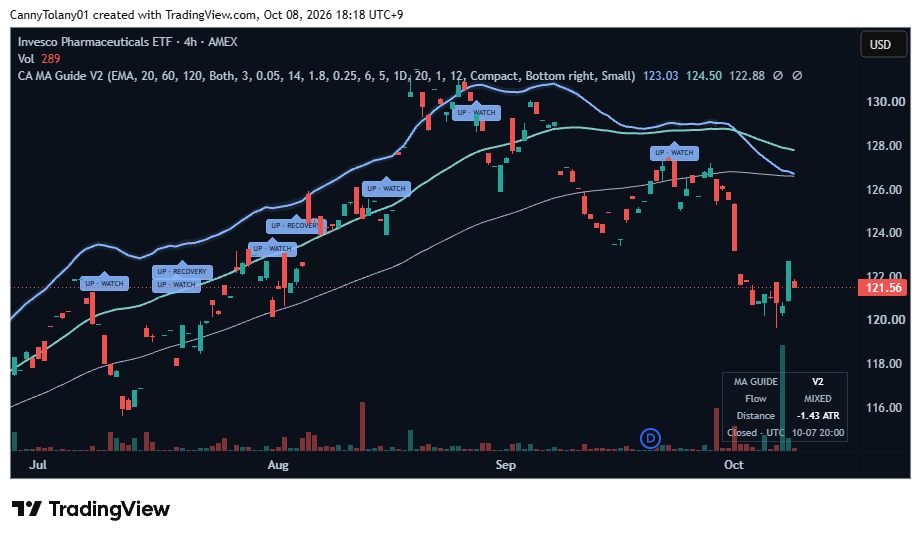
TREND OBSERVATION
TradingView