
1. Buy half on the breakout
When a daily close finishes above the highest close of the previous 20 candles, buy half (50% of your account) at the next candle’s open.
In a 27 February 2026 Morgan Stanley “Hard Lessons” interview, Stanley Druckenmiller, whose Duquesne Capital reportedly averaged about 30% a year with no losing year from 1981 to 2010, shared the biggest lesson he learned from George Soros: “It’s not whether you’re right or wrong, it’s how much you make when you’re right and how much you lose when you’re wrong.” He described buying a “not-big” Nvidia position, doubling it after ChatGPT appeared, then doubling again. ChartArmory’s Half & Double turns that sizing idea into a clear, mechanical price rule for TradingView.
Half at the 20-close breakout → ×2 at +1 ATR → sell all on the 3 ATR trailing stop · 0.1% cost per buy and per sell included
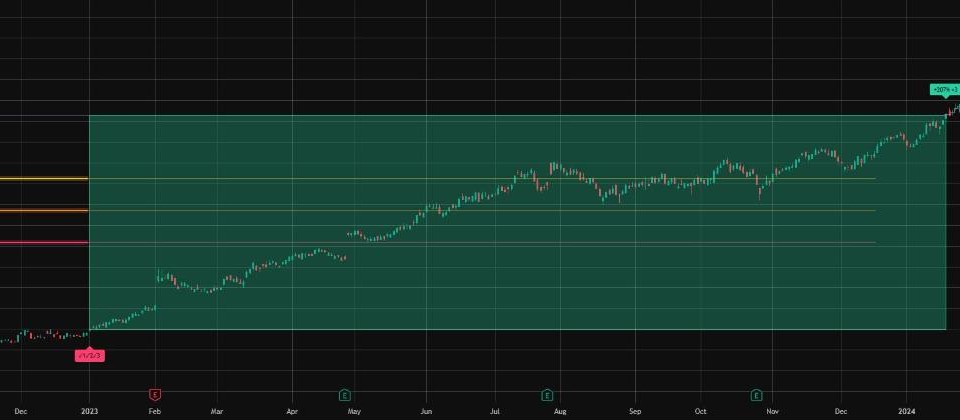
On the Coinbase Solana daily chart, the close of 20 September 2023 beat the previous 20-close high, so ½ bought half the account at the next open on 21 September ($20.30).
Account change = value after the final sale ÷ value before the first buy − 1, with half the account buying at the first fill, the rest at the double fill, and 0.1% cost on every buy and sell.
Download the case data (JSON)Going all-in from the start, becoming a top detector, and getting stuck
Start light: a friendly ½ brake mark tells you to buy only half
Even in profit, frozen about when to add more
When price climbs 1 ATR more, a ×2 booster mark doubles the position
Recalculating a stop that changes every morning, head pounding
A 3 ATR defense line that follows the trend, drawn for you
When a daily close finishes above the highest close of the previous 20 candles, buy half (50% of your account) at the next candle’s open.
When a close finishes 1 ATR (20-candle average true range) above your first fill, buy the other half at the next open to reach full size.
When a close falls 3 ATR below the highest close since entry, sell everything at the next open.
Daily data from 2018 with a 0.1% cost each side, comparing Half & Double with the same signals bought all-in and with simply holding. The half start did what it promises on losing trades: on Bitcoin the average losing trade was −8.3% against −10.4% all-in, and the worst single trade −15.0% against −26.5%.
| Market | Half & Double / yr | All-in / yr | Buy & hold / yr | Worst trade | Worst trade all-in | Deepest drop | Hold deepest drop |
|---|---|---|---|---|---|---|---|
| Bitcoin | +22.8% | +23.4% | +22.4% | −15.0% | −26.5% | −67.1% | −81.4% |
| Ethereum | +44.1% | +43.1% | +14.3% | −16.2% | −26.0% | −52.5% | −94.0% |
| Solana | +65.4% | +78.0% | +23.4% | −18.1% | −30.0% | −64.0% | −96.3% |
| Tesla | +27.0% | +22.0% | +38.1% | −18.7% | −31.1% | −51.0% | −73.6% |
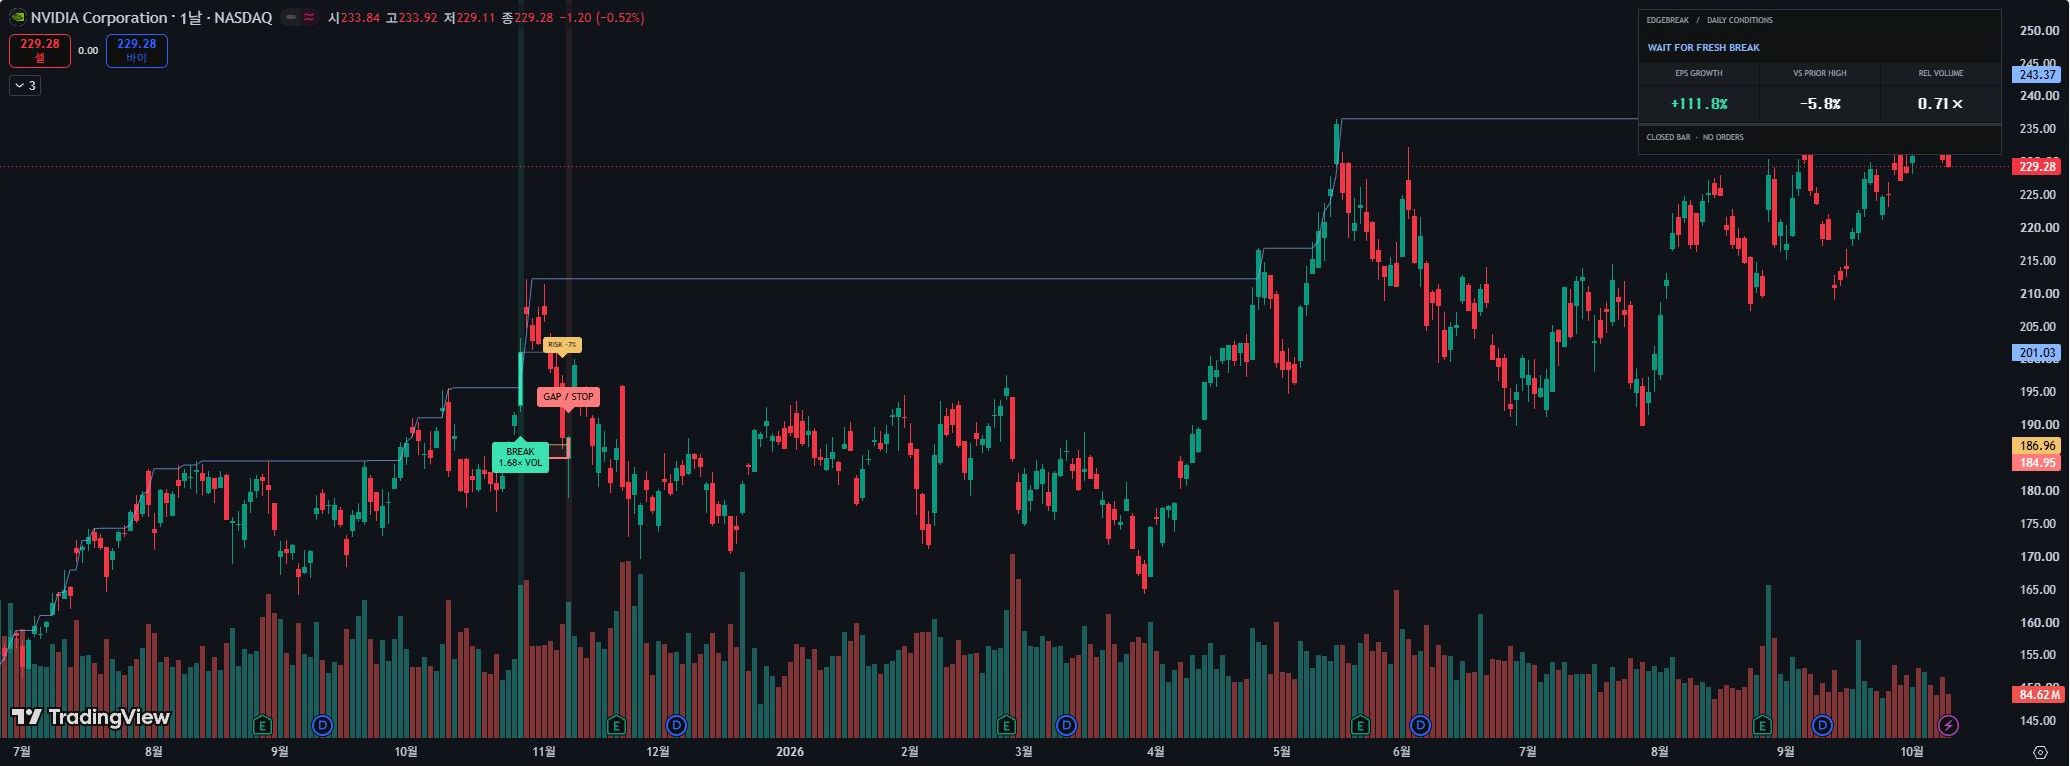
| NVIDIA | +29.1% | +32.0% | +53.7% | −12.9% | −20.6% | −35.7% | −66.4% |
| Nasdaq Composite | +8.7% | +10.2% | +16.3% | −5.4% | −7.4% | −16.7% | −36.4% |
| S&P 500 | +5.1% | +6.6% | +12.7% | −6.1% | −5.5% | −13.5% | −33.9% |
| Gold futures | +4.5% | +2.6% | +14.2% | −6.5% | −13.0% | −25.8% | −24.9% |
Daily 2018–2026 · 0.1% cost on each buy and sell · single trade
Bitcoin’s worst trade: All-in −26.5% → starting with half −15.0%
Solana’s worst trade: All-in −30.0% → starting with half −18.1%
The defaults work as delivered. Change the lookback, first-buy %, double distance, stop distance, cost, start year and panel language in settings.
Past performance does not guarantee future results.
An independently coded tool inspired by the sizing lesson Stanley Druckenmiller described in public interviews, with ChartArmory’s own rule, chart display and scorecard. Not affiliated with or endorsed by Stanley Druckenmiller, George Soros or Duquesne, and he does not use this indicator.
No. This is independent work by ChartArmory. It is not affiliated with or endorsed by Stanley Druckenmiller or George Soros, and Druckenmiller does not use this indicator.
No. Signals are calculated on closed candles and fills are modelled at the next candle’s open, so closed history never changes. During a live candle the pending decision can change until the candle closes.
You can edit it for personal use. Sharing, redistribution and resale rights are not included.
One-time payment. Full Pine Script v6 source code, 8-language scorecard and install guide, and 30-day bug support, with no hype and every number on the table.
Delivery & refund policy ↗TOP WARNING
CRASH BUYING
TREND BREAKOUT
VOLATILITY BREAKOUT
LONG-TERM TREND
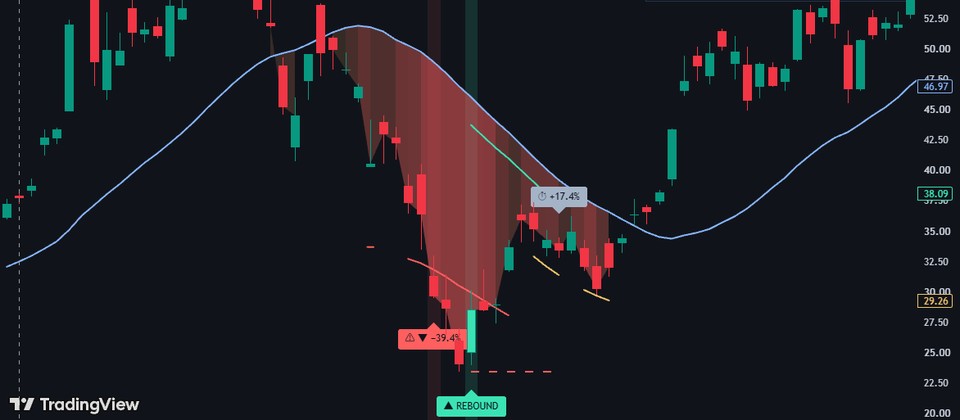
REBOUND OBSERVATION
BREAKOUT OBSERVATION
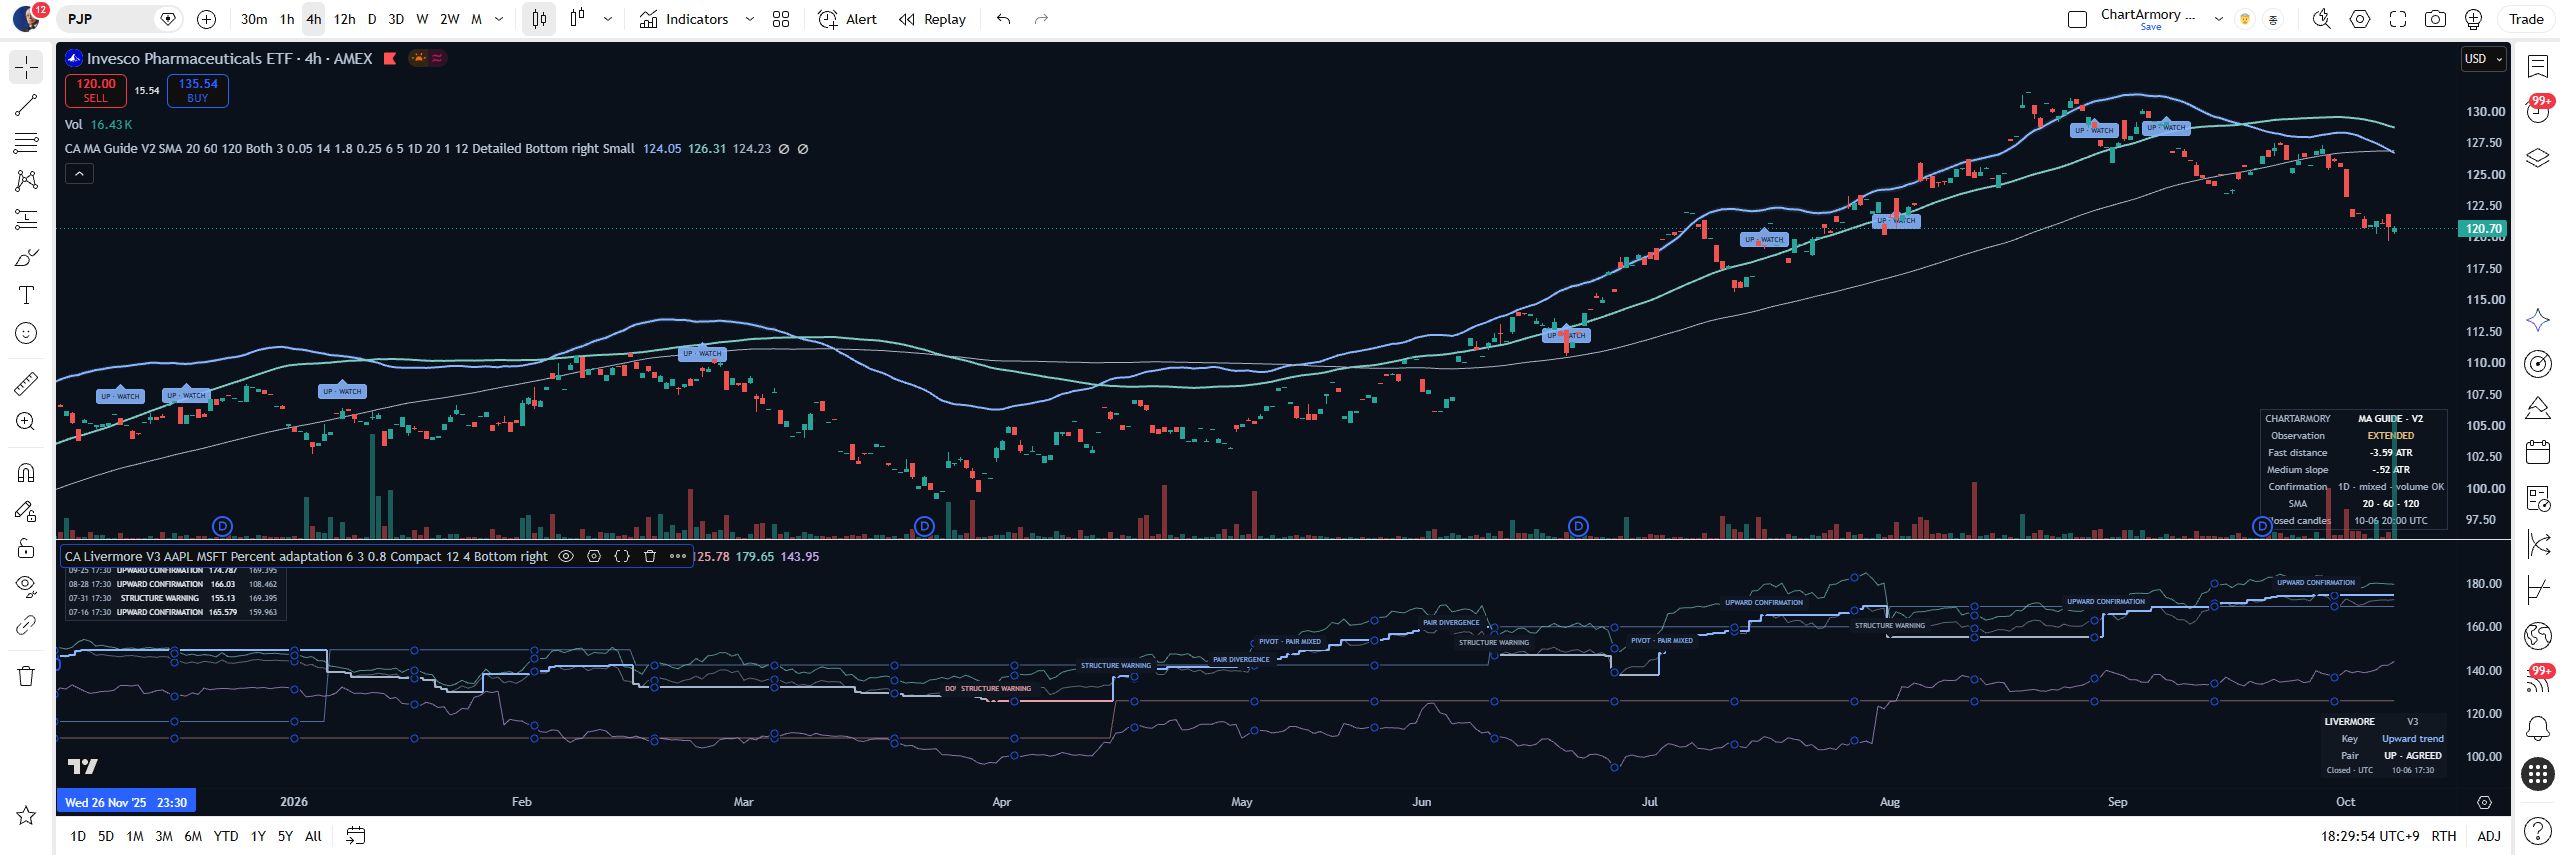
LIVERMORE · V3
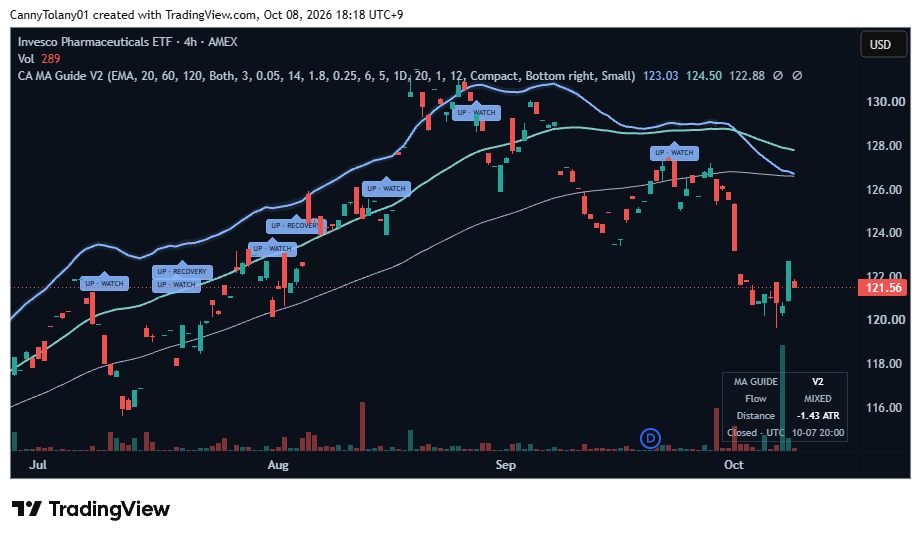
TREND OBSERVATION
TradingView