
Symbols for stretch, rebound and exits
Record the oversold warning (▼), the first close above the prior high within 10 bars (▲), and subsequent average-return, low-break or time conditions (✓ ✕ ⏱) on confirmed daily bars.
Measure how far the close sits below its 25-day average and mark the first confirmed rebound after an oversold warning. Adjust the thresholds and full source code for your own daily observations; returns are not guaranteed.
Rebound close → time-exit close · before costs
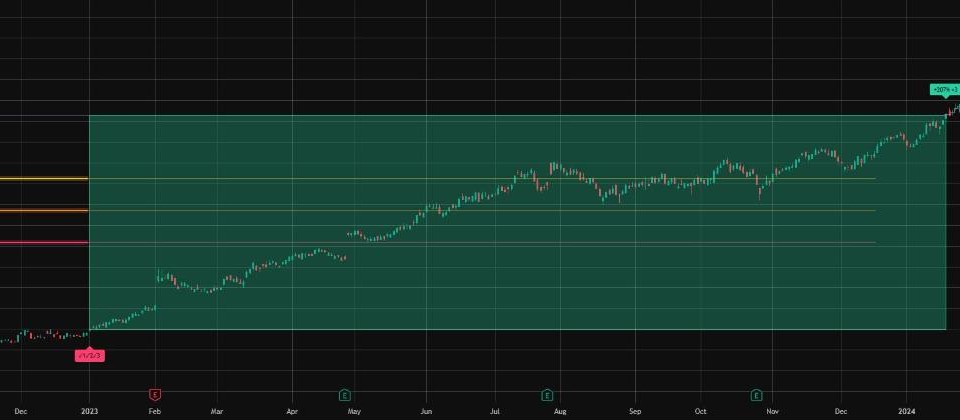
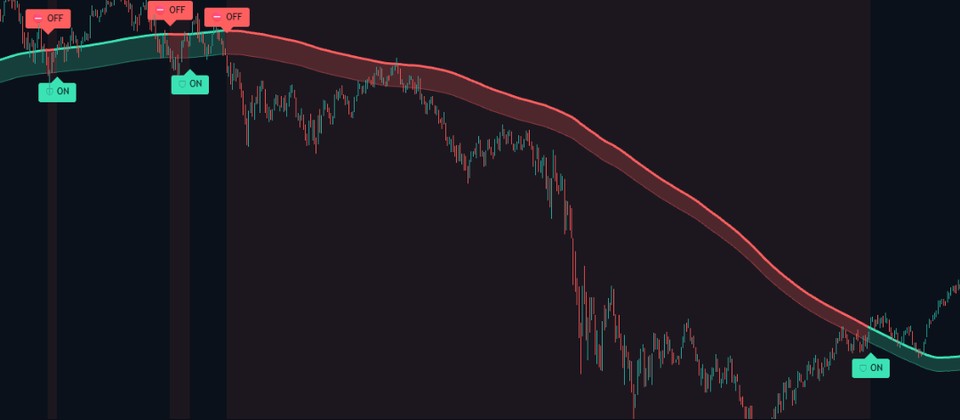
A real chart period on Tesla daily in March 2020, recorded with the default settings.
TSLA, March 2020. After the oversold warning, we tracked the first confirmed rebound through the scheduled time exit.
Change = (exit close ÷ rebound close − 1) × 100. Execution at those closes is assumed, not verified. No separate tax, dividend or slippage calculation.
"It's down a lot", so you guess the bottom by feel
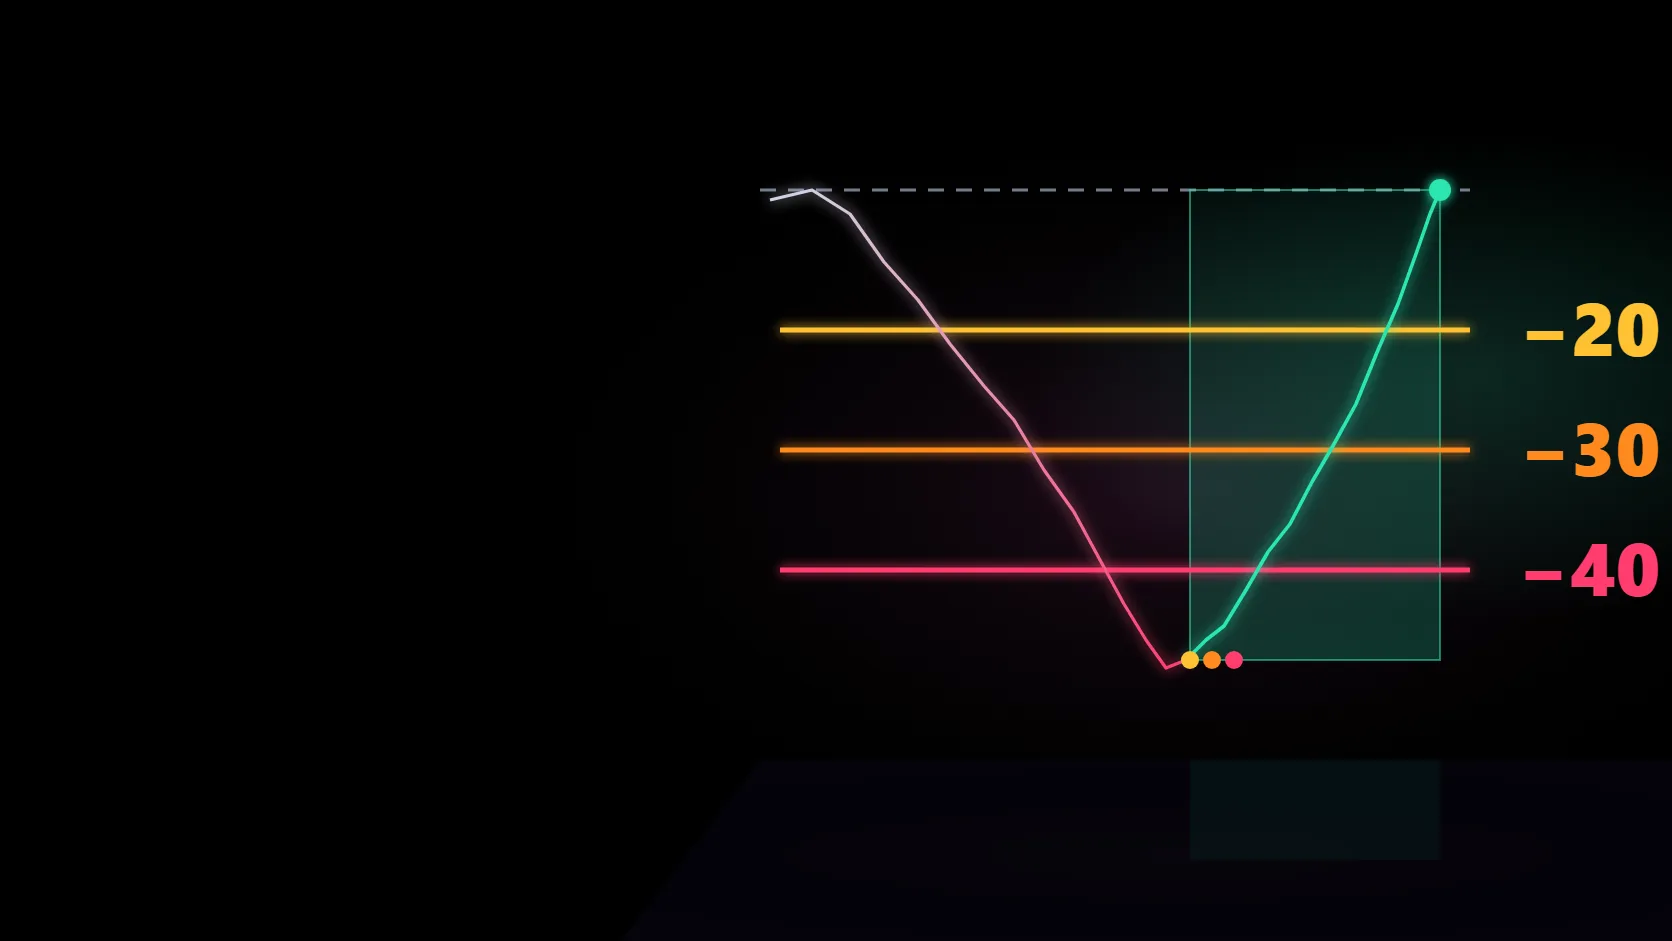
▼ oversold warning once the 25-day gap passes −20% (−35% in a panic)
You grab the falling knife and end up in the basement
Entry only on the first rebound (▲) that closes above the prior high after ▼
Even after a bounce you don't know when to sell and give it all back
Clean exits marked: back within 5% of the average ✓ · low broken ✕ · 7 bars ⏱
Record the oversold warning (▼), the first close above the prior high within 10 bars (▲), and subsequent average-return, low-break or time conditions (✓ ✕ ⏱) on confirmed daily bars.
Shift the threshold from −20% to −35% when the relevant index is at least 8% below its 25-day MA. Automatic index mapping covers US listings, KRX and TSE only.
See the stretch shading and current state and next condition on an English/Korean panel. Customize settings and the Pine v6 source for personal use.
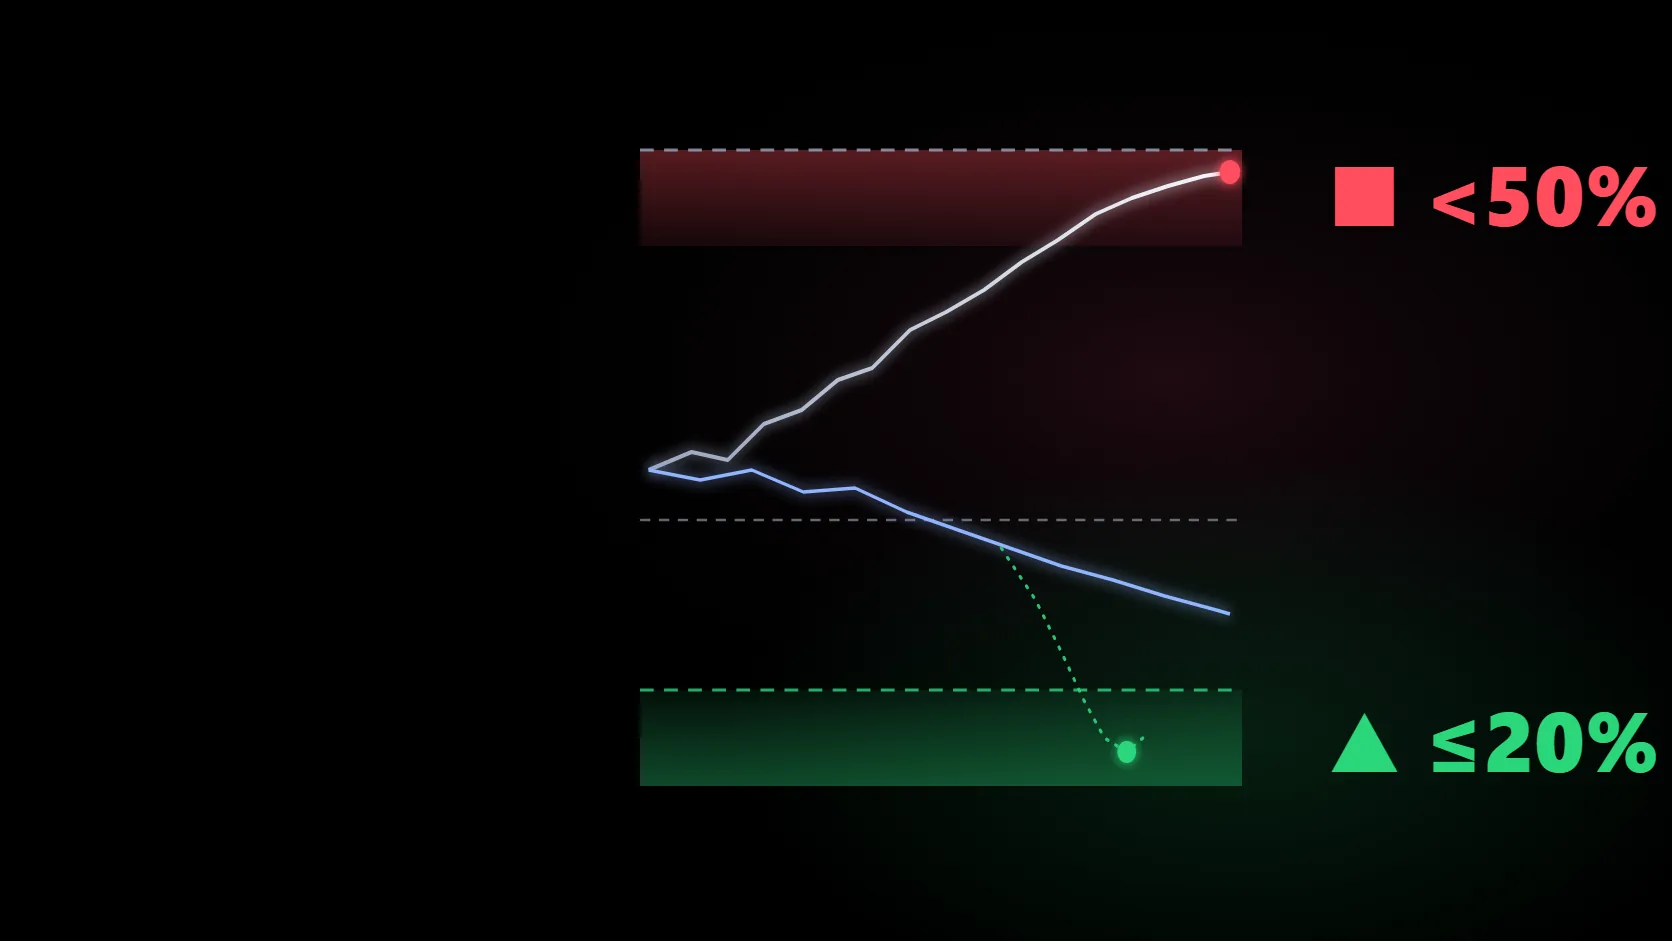
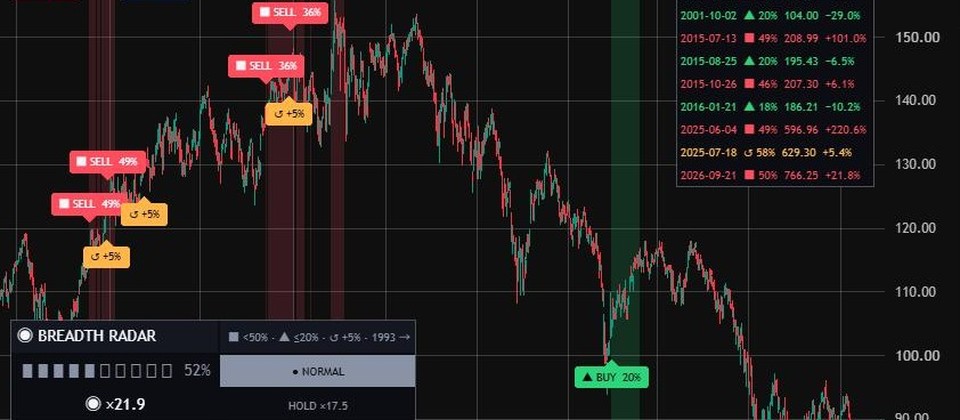
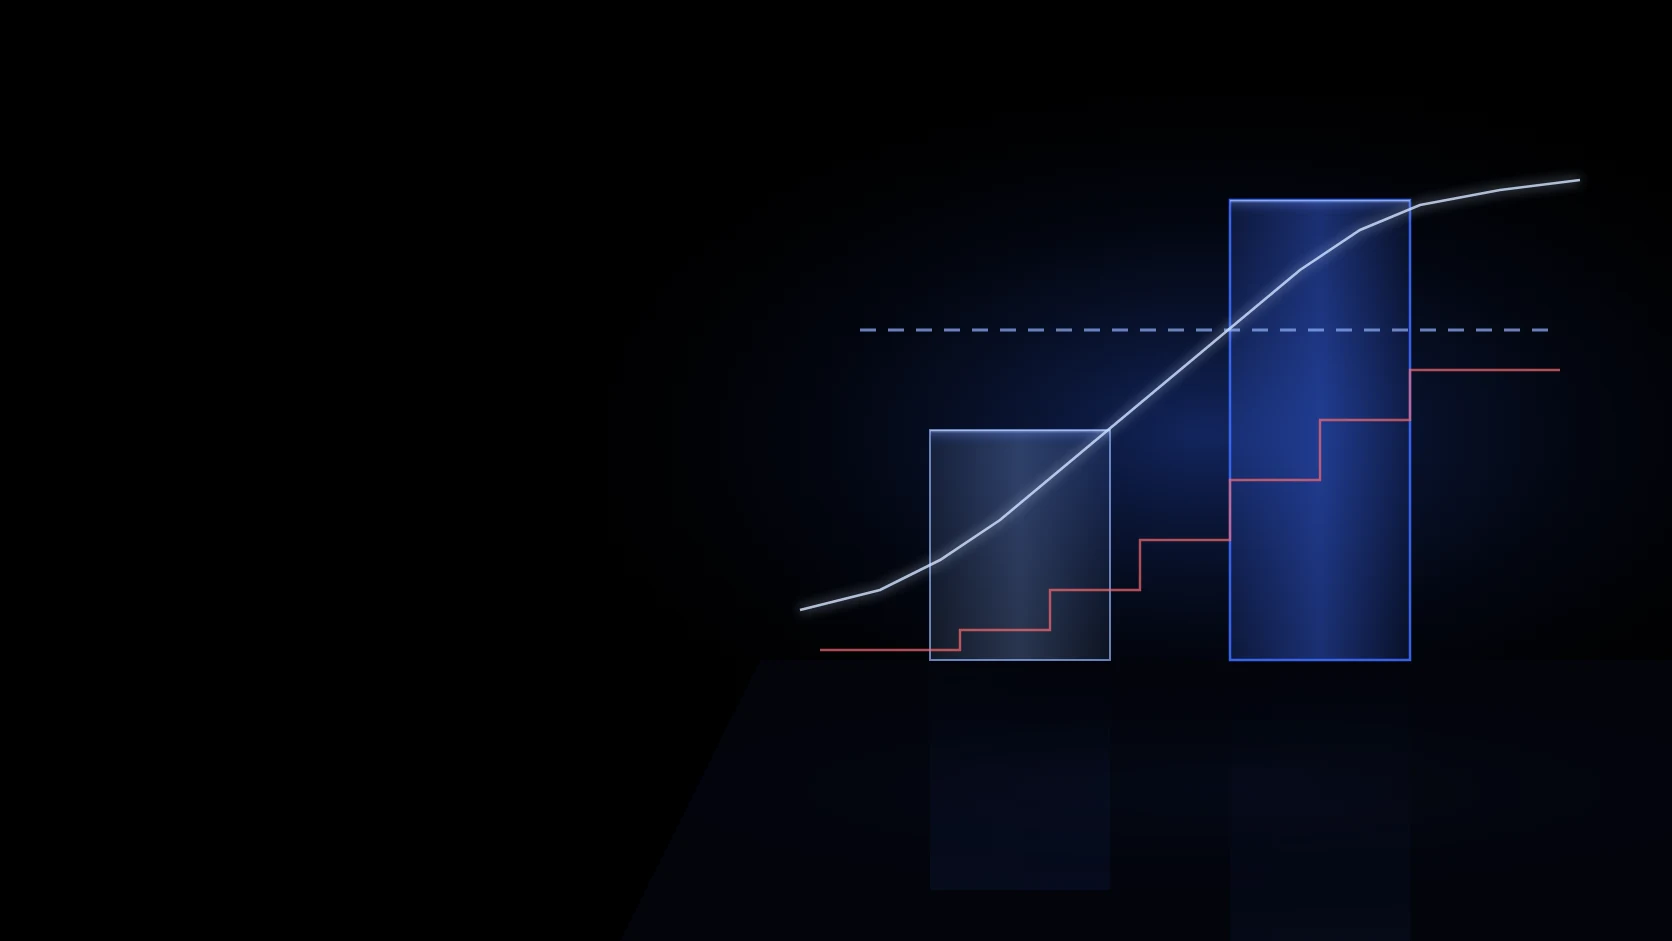
Feature illustrations, not actual prices or performance.
We ran the default rules on past daily data. The results do not establish a return advantage.
| Group | Trades | Mean | Median | Positive | Worst |
|---|---|---|---|---|---|
| All rebounds | 430 | +0.75% | +1.12% | 54.9% | −42.5% |
| ⚠ Market-panic rebounds | 50 | +9.49% | +11.28% | 66% | −40.8% |
| Normal-market rebounds | 380 | −0.41% | — | — | — |
| Benchmark: random 7-day hold | 3,240 | +0.59% | — | 52.1% | — |
Buying at the first −20% close vs waiting for the first ▲ rebound (daily, 0.1% cost per side)
2008 BAC: buying right away took $1,000 down to $132. Five trades by the indicator: +37.0% (→ $1,370)
2022 META: buying right away took $1,000 down to $374. Two trades by the indicator: +9.9%
2022 Ethereum: buying right away took $1,000 down to $388. Four trades by the indicator: +21.4%
After payment, copy the code with one button or download the TXT.
Past performance does not guarantee future results.
An independently coded interpretation of the publicly described moving-average deviation (“kairi”) approach associated with the Japanese trader known as BNF. Not affiliated with or endorsed by him.
Kairi (乖離) is Japanese for “deviation”. Here it means how far the close sits below its 25-day simple moving average, in percent.
No. ▼ only warns that price is stretched. The indicator then waits for ▲ REBOUND, and even that is a chart observation, not a recommendation.
It runs on any daily chart. The automatic panic check uses the S&P 500 for US listings, KOSPI for KRX and the Nikkei 225 for TSE. Elsewhere it uses the normal −20% zone unless you choose a custom index.
Marks are confirmed on the candle close and stay where they were drawn. Before the close, the panel’s live values can still change.
No. It is ChartArmory’s own code based on publicly described ideas. He has not reviewed or endorsed it.
You can edit it for personal use. Sharing, redistribution and resale rights are not included.
Own the complete source and install guide with one payment, then tailor the daily observation rules for personal analysis.
TOP WARNING
CRASH BUYING
POSITION SIZING
TREND BREAKOUT
VOLATILITY BREAKOUT
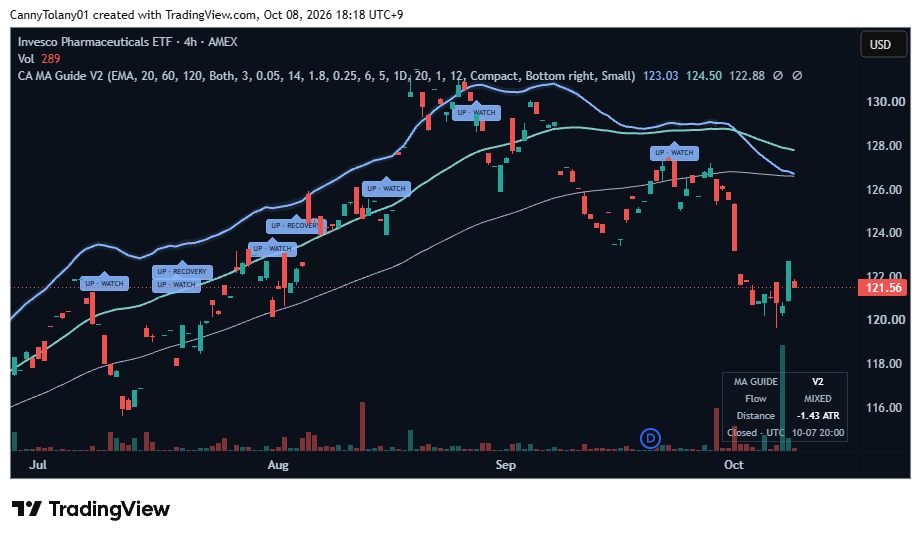
LONG-TERM TREND
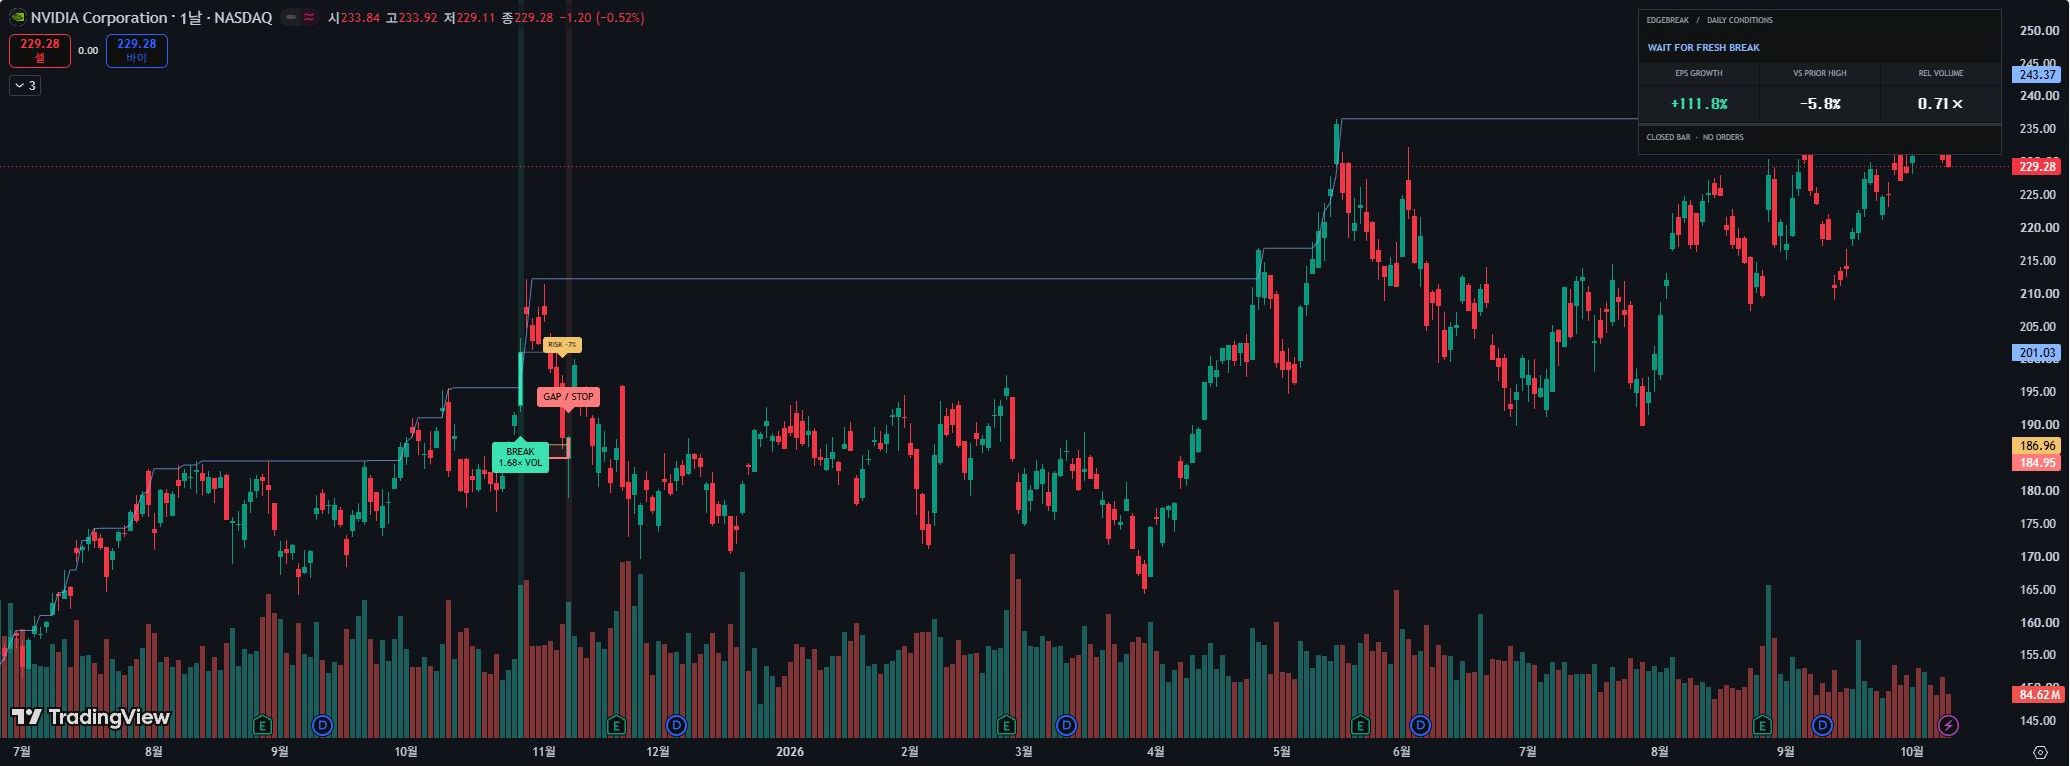
BREAKOUT OBSERVATION
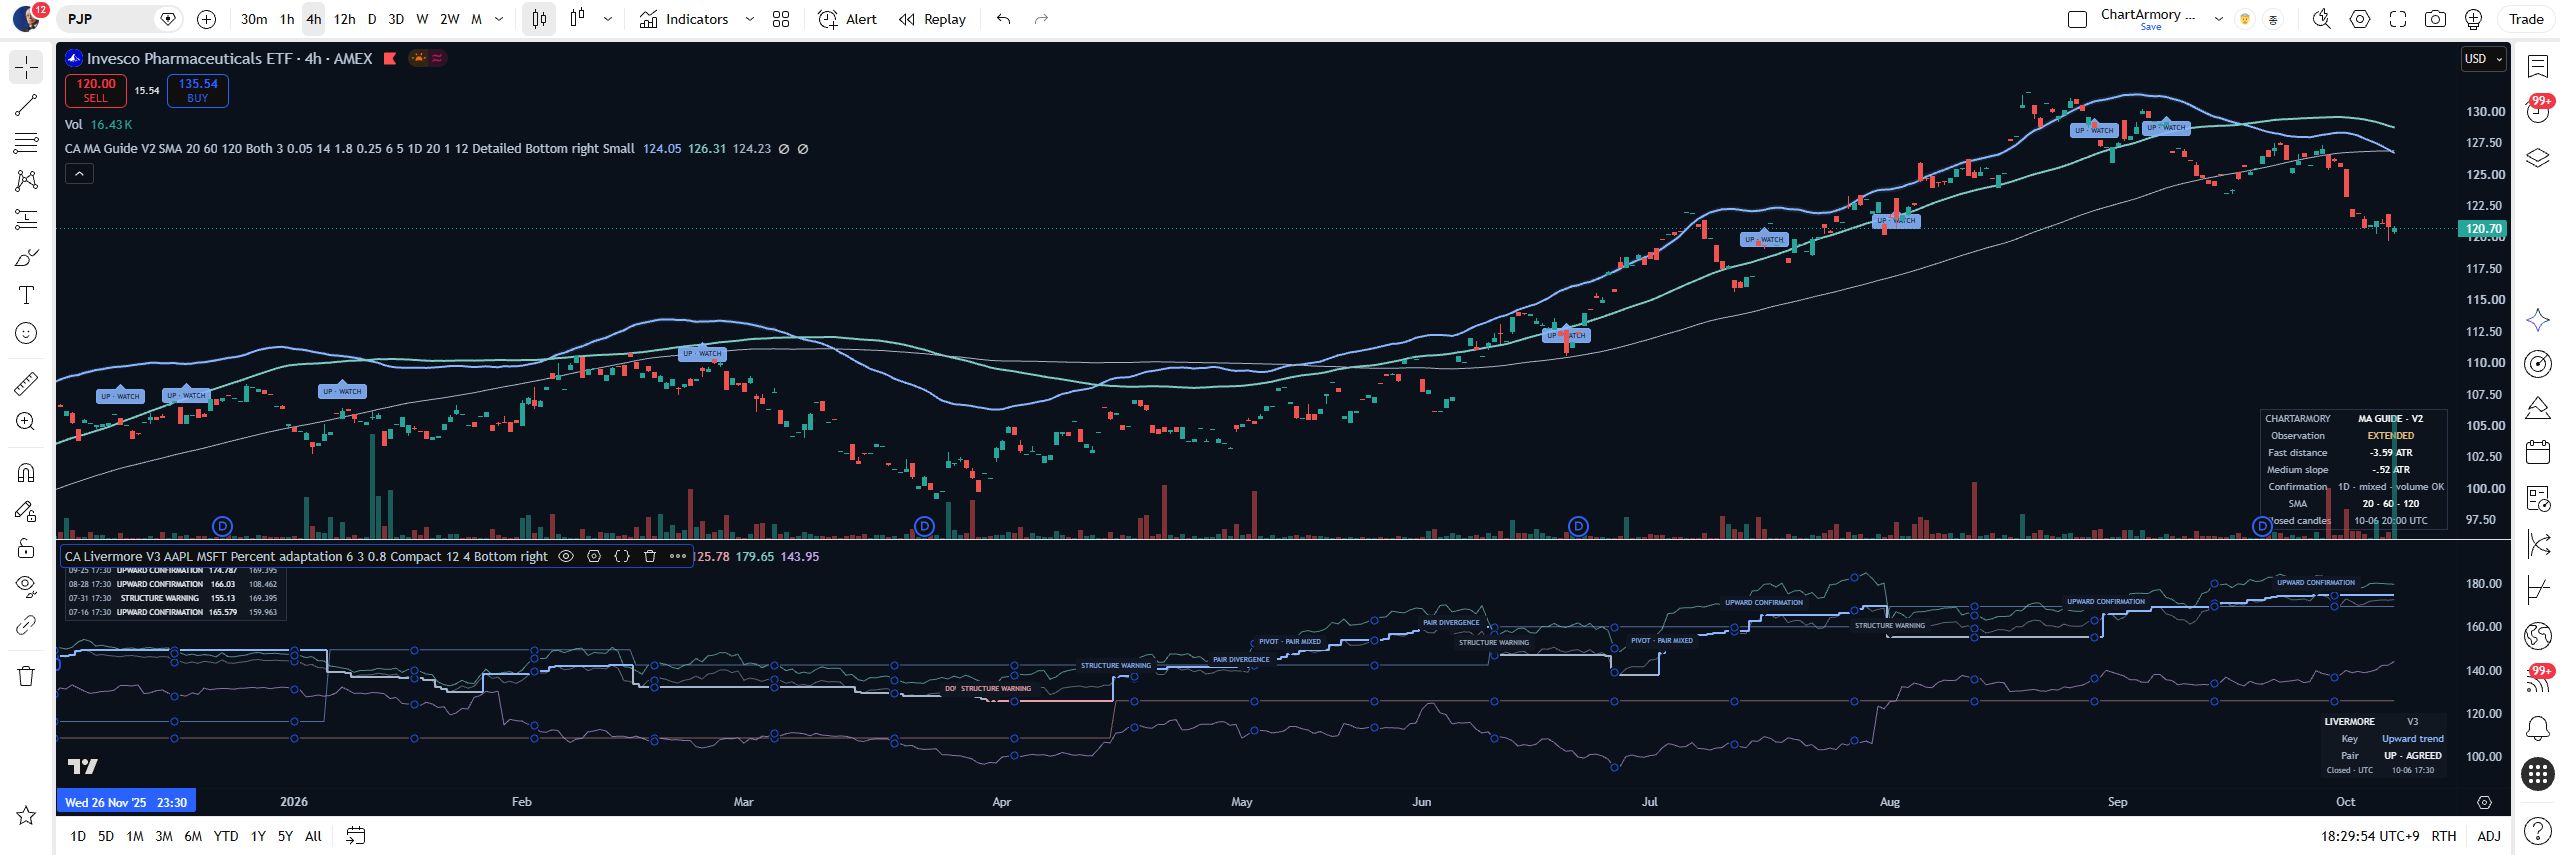
LIVERMORE · V3
TREND OBSERVATION
TradingView